
The Results section is only relevant to users who have successfully run Batch Configs in the Scenarios section. It therefore also requires the user workspace to be set up.
Purpose of the Results section
The Results section enables summarisation and visualisation of output from HEM simulations successfully run in the Scenarios section, and stored in the output folder in the user workspace. The Config dropdown lists saved Batch Configs. Metrics and graphs are available only when matching output files exist.
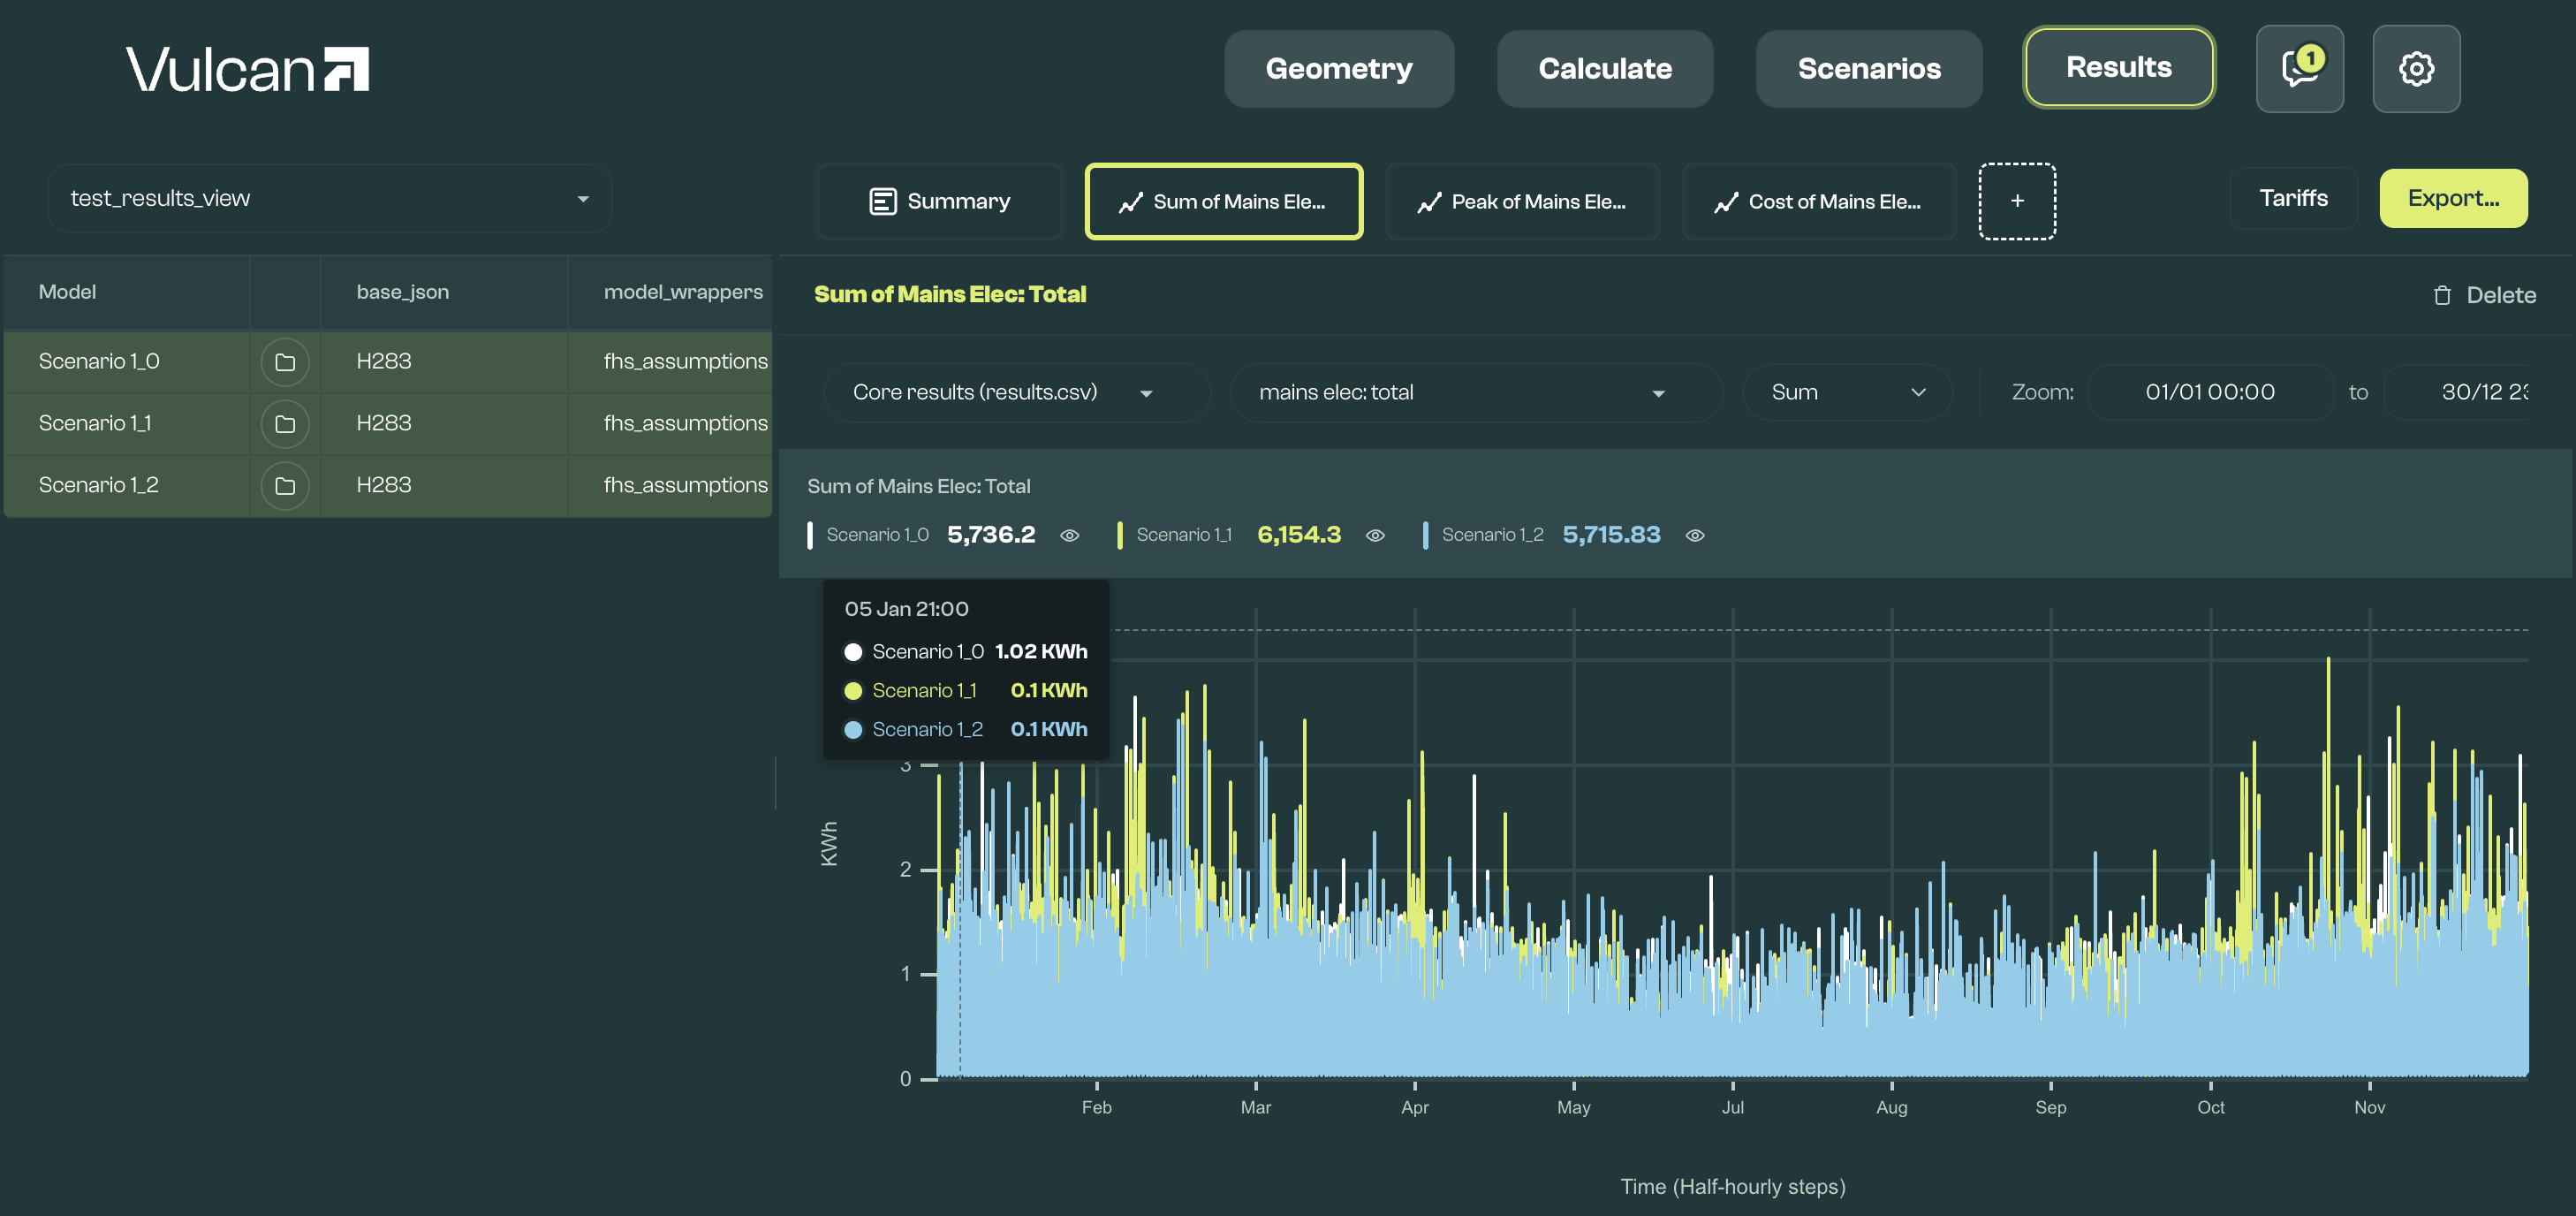
View Config inputs
Selecting a Batch Config from the Config dropdown shows all permutations from that Config in the Inputs table. This table is horizontally scrollable, and the section is expandable, to show the parameter variations for each created scenario.
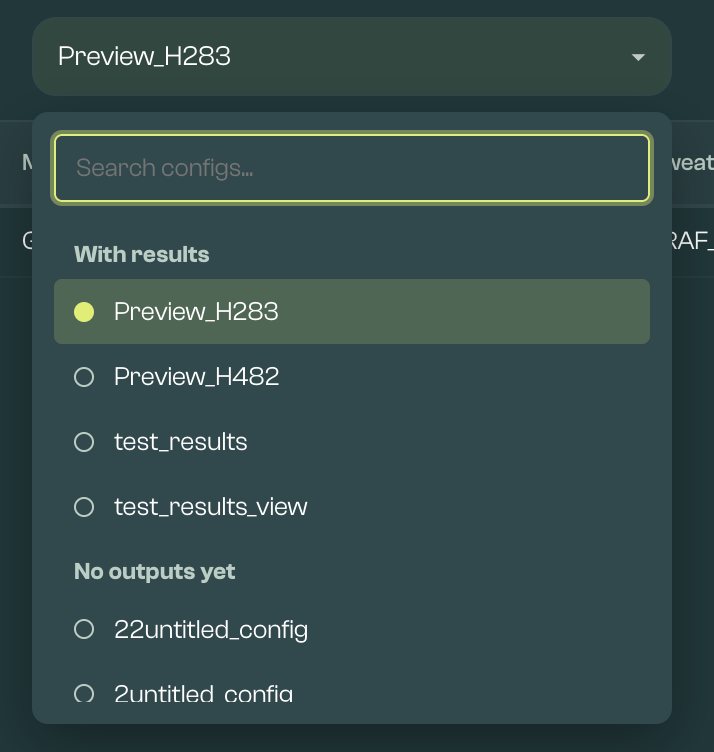
Outputs by Wrapper
Output files depend on the model_wrappers parameter set in the Batch Config for that specific model. Runs are written to output/result_<config>_<scenario>_<n>.
FHS Assumptions
The fhs_assumptions wrapper applies FHS preprocessing, including standardised occupancy, gains, and schedules. It runs a single calculation rather than the full compliance suite.
Use case: Core calculation comparable to FHS compliance "actual" values
Outputs: Files ending in results.csv (detailed half-hourly), results_summary.csv (annual summary), and results_static.csv, with FHS-standardised assumptions
FHS Compliance
The fhs_compliance wrapper runs multiple calculations:
- FHS actual with FHS assumptions
- FHS FEE (Fabric Energy Efficiency)
- FHS Notional
- FHS Notional FEE
Use case: Full FHS compliance assessment
Outputs: fhs_compliance_report.json (main report) + multiple result sets
The Results section checks which expected output files are actually present for the selected Batch Config and selected models. Metrics and graphs that depend on an output file that is not present may be hidden or unavailable until the relevant simulation output exists. Compliance metrics are shown when a compliance output is available.
View, Edit and Create metrics
Metrics are aggregations of specific columns in output files. Metrics are stored in JSON format files in the user workspace under input/analytics.
Common metric fields include:
resultsKey: the result source key; if omitted,resultsis used.label: the auto-generated label shown for the metriccolumn: the column in the output file aggregated for the metricfuncType: the metric type, such assum,average,peak,min,cost,sumIf,averageIf,countIf, orcompliancecomparator: used forsumIf,averageIf, andcountIf; can be>,>=,<,<=, or=threshold: number used for conditional metrics, defaulting to0
Cost metrics require retailer and tariff. Conditional metrics require comparator and threshold. Compliance metrics use JSON rather than CSV.
The default metrics config is input/analytics/default_metrics.json. Some batch configs may also have their own metrics file in input/analytics.
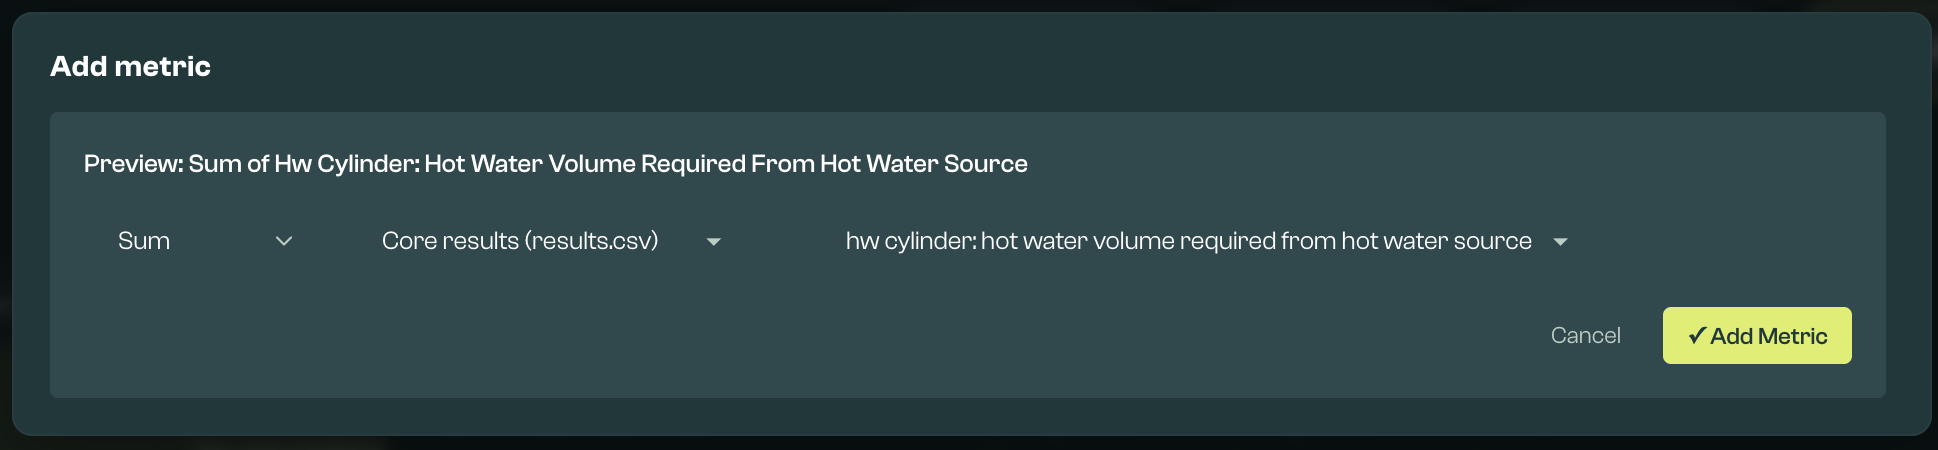
Metrics can be viewed in the Summary Table or in Graphs by clicking files in the Inputs table. Every metric in the Summary table has a detailed Graph. Clicking + Add Chart on the Summary table, or the + tab, allows metrics to be added to the analytics config. Metrics can be edited within their Graphs.
When creating or editing a metric, choose the result source that contains the column you want to analyse. The default source is results.csv; other sources only appear when those files exist for the selected run.
Graphs can be zoomed by dragging over a range, and reset by double clicking. The aggregation shown on the graph changes to reflect the zoom range.
Edit Tariffs
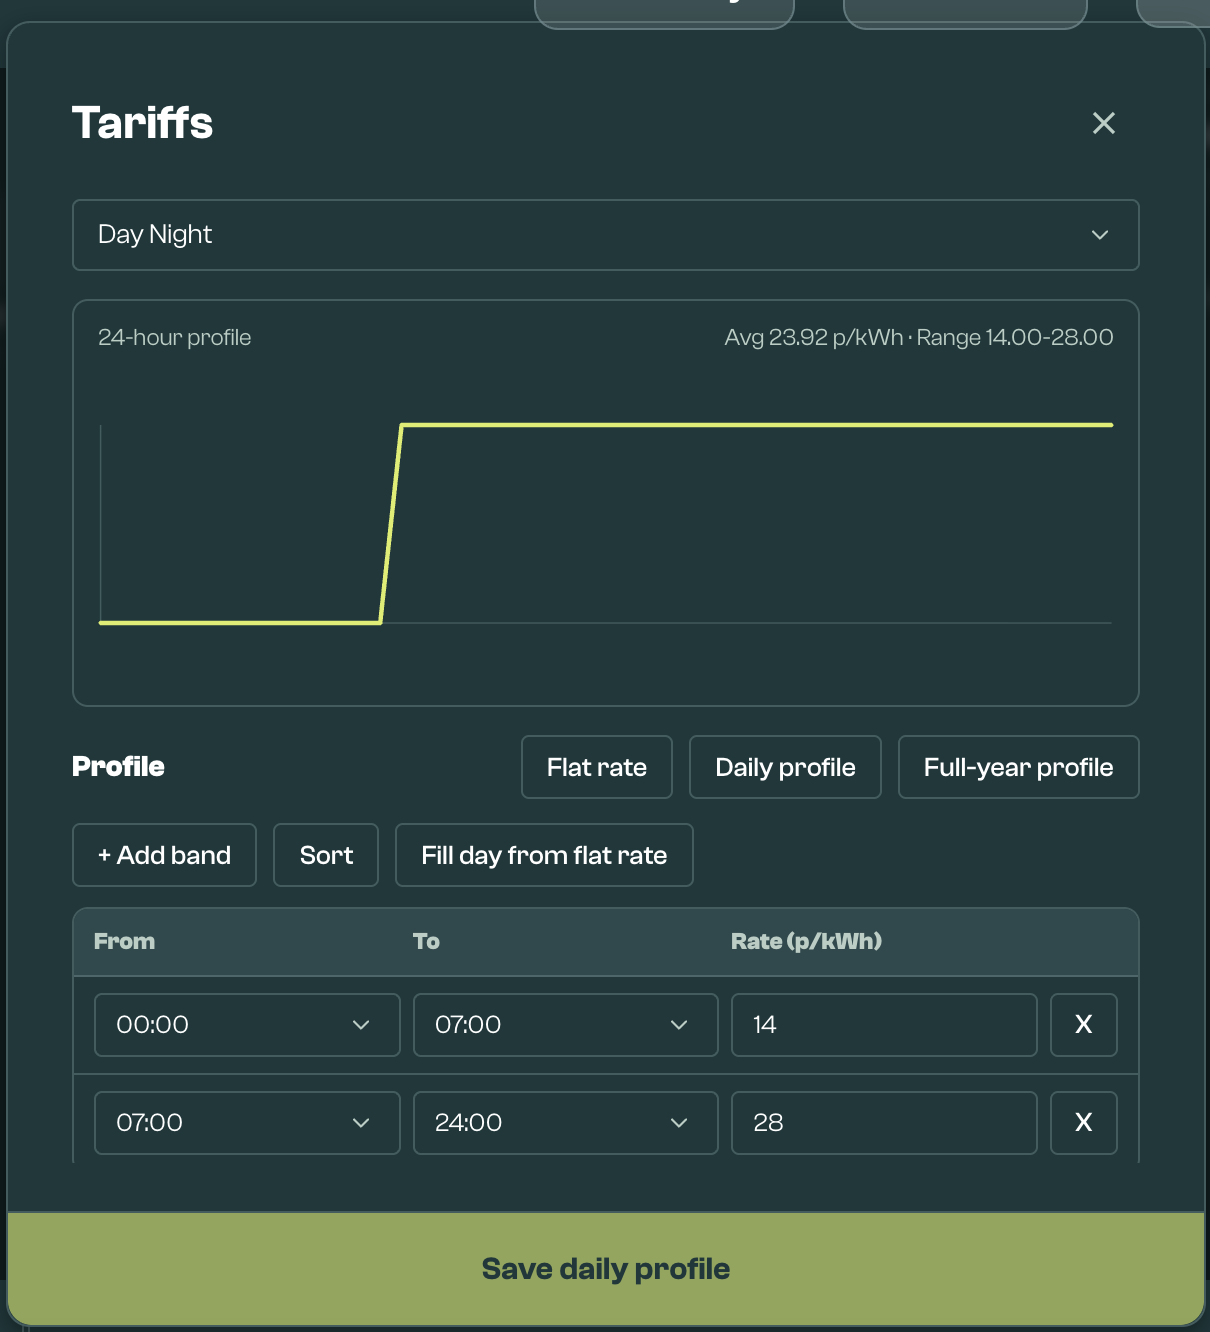
Tariffs are saved in the input/tariff_data_structured folder in the user workspace. Each retailer creates a CSV file, with each tariff as a column in that file.
Tariffs can be created or edited using the Tariffs modal near the top right of the tab.
Export Results
Use Export to download:
- the Inputs table, listing the scenarios and permutations in the selected Config
- the Metrics table for the selected models
- the currently open graph as a CSV file