Introduction
In this case study we compare the Home Energy Model (modelled with Vulcan) with SAP 10.2 (modelled with Elmhurst DesignSAP).
We modelled a 1980s two bedroom and two-story semi-detached dwelling located in South London. The property had insulated cavity brick walls, 20-year old double glazed windows, and used a combi gas boiler.
Modelling this property was more challenging than HEM validation studies carried out on “model” homes with complete or measured datasets (such as the Camden Passivhaus). We had to research thermal properties and had fewer calibration points, which impacted the accuracy of our modelling
Nevertheless this case study illustrates many of HEM’s advantages over SAP.
Step 1: Data collection
We collected data in person - while we received photos and a floor plan before we wanted to accurately measure internal dimensions, and capture internal data on occupants and systems. There were a number of differences between the data we collected for the Home Energy Model, and what would be collected for a SAP assessment:
- We collected data and defined inputs for each room of the dwelling individually. The Home Energy Model enables dwellings to be split into unlimited zones, and identify problematic areas through the lens of unmet heating or cooling demand, and operative temperature. In contrast SAP only has 2 zones preventing such targeted analysis.
- We collected detailed occupancy patterns, to create schedules for metabolic gains, appliances (electronics, fridge, oven etc.), cooking (e.g. hob gas consumption), hot water (shower and bath uses) and lighting. Through engagement with the occupants and with the help of the National Calculation Methodology (v6.1e), we created schedules on an hourly basis for each day of the week and room type. Modelling real occupancy patterns is important to predict realistic energy use, and understand the likely impact of improvements. Custom and detailed schedules are neither possible nor meaningful with SAP, as energy use is standardised and blended into monthly time steps. This was important in our study as the occupants behaved very differently to standard SAP assumptions.
- We collected data on shading. This included shading from the eaves of the modelled dwelling, and nearby houses. Shading is again neither possible nor meaningful in SAP, but is important in HEM as solar gains may be mitigated (or not) by shading at specific time steps.
- We collected radiator dimensions and estimated distribution pipe lengths. HEM doesn’t use static setpoint temperatures like SAP, it instead calculates the balance of all sources of heat gain or loss to estimate temperature at every time step. This means that HEM can be used to test the suitability of heating system and distribution design.
- We modelled natural ventilation through openable windows by defining their equivalent area. HEM recognises both single-sided and cross-ventilation based on window orientation and size which is reflected in ventilation efficiency, air flow rates and ultimately thermal comfort (i.e. operative temperature). This was very important in this specific case study as occupants relied on natural ventilation.
- Individual building elements such as walls, windows and doors have new properties such as construction mass distribution and solar absorptance, to better model how heat energy is absorbed and transferred into the dwelling.
We also received monthly electricity and gas meter data from the occupant which we used to assess the accuracy of our model.
There are further data point we wanted to collect but didn't:
- Air permeability was described by the occupants as “3 out of 5” - we used this instead of building regulation assumptions, but ideally we would have conducted a pulse or blower test to collect a real result.
- We would could have directly calibrated sub-hourly energy meter or temperature data with the outputs of the Home Energy Model.
- We could also have used a total Heat Transfer Coefficient measurement to calibrate our model output.
Further measurements would have reduced reliance on researched assumptions. Luckily our researched data yielded a modelled baseline that fit observations, but if it hadn't then these datapoints would have enabled us to triage the differences between modelled and actual results.
All in all our visit was concluded in an hour (minus tea breaks). This short duration was driven by the simple nature of the dwelling, and preparedness of the occupant.
Step 2: Data enrichment and model inputs
For each building element we researched thermal properties, then organised parameters into a structure accepted by the Home Energy Model.
This can take a lot of work! The Home Energy Model requires structured JSON inputs and accepts over 200 different parameters, and there’s limited technical guidance on how to create the inputs. For now the Home Energy Model is a puzzle of Python code, BSI EN standards and prose documentation.
Vulcan aim to make using the Home Energy Model simple. In this case study we automated conversion of data we researched or collected into correctly structured Home Energy Model inputs. This saved hours for every scenario we modelled! Even though the dwelling we modelled had a simple rectangular geometry, it still had 28 modelled surfaces (70% construction / 30% thermal bridges) and almost 500 related inputs.
Once we modelled the dwelling with the Home Energy Model and SAP, we were ready to analyse results.
Step 3: Analysis of model outputs
Comparison of HEM and SAP
The actual energy use intensity of the dwelling (from a year of meter readings) was 101 kWh/m². With realistic occupancy schedules we modelled 97 kWh/m² with the Home Energy Model (4% less than actual). In contrast SAP predicted an EUI of 142 kWh/m² (40% more than actual).
Though HEM and SAP predicted similar energy bills (SAP: £856/yr, HEM: £862/yr), only HEM accurately predicted the split between electricity and gas.
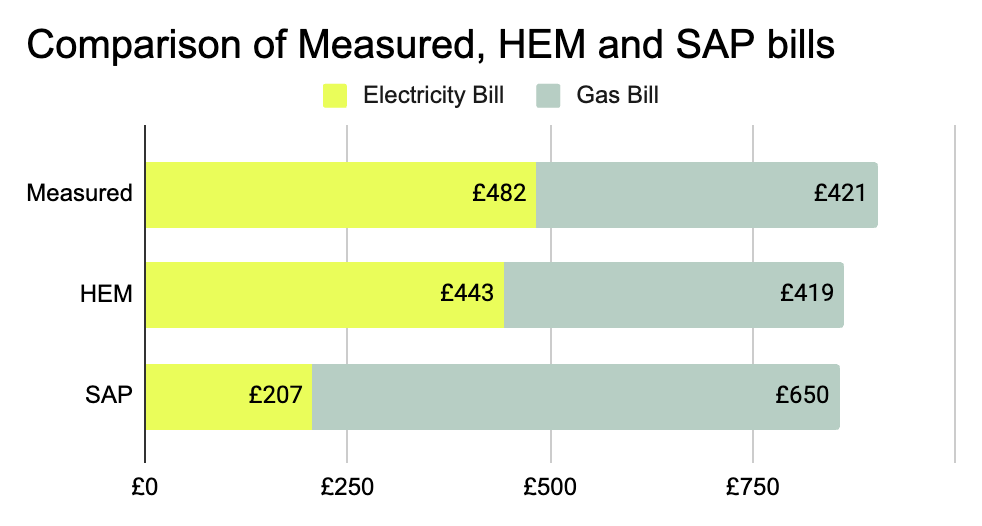 HEM more accurately predicts measured energy bills than SAP
The difference in electricity consumption is primarily due to SAP not modelling “unregulated electricity use” of appliances such as TVs, fridges and computers. The Home Energy Model predicted this was 85% of total energy use, and yielded a total electricity consumption close to measured reality.
The more interesting difference is gas consumption from space heating and hot water. SAP significantly over-estimated consumption, while HEM was very accurate (1% difference).
There are two big causes of the differences between SAP and HEM. First, HEM uses a fundamentally different methodology. HEM's use of half-hourly time steps means realistic modelling of energy supply and demand at any given point in the day, and a more accurate total than SAP’s monthly calculation.
Second, HEM enables input of actual values where SAP uses assumptions. Every new data point we collected for HEM is implicitly assumed by SAP. For example SAP uses 21°C set point temperatures year-round. The building occupants told us they preferred it around 18°C, only heated their home part of the year, and kept windows and doors open for ventilation. This realistic energy use is reflected in a much lower space heating demand modelled by HEM (32.69 kWh/m² in HEM vs 91.23 kWh/m² in SAP, or 2.8x lower).
HEM's temperature analysis
In addition to granular outputs on energy consumption, the Home Energy Model offers sub-hourly temperature for every modelled zone. In SAP temperatures are an input and heating systems always meet demand. HEM models heat balance at every time step, making it useful to size heating or cooling systems and understand their impact on operative temperature.
This means HEM can predict when and why a dwelling overheats or underheats.
Using custom ventilation schedules was important to model realistic temperatures. We heard the occupants regularly kept windows open. Without this most spaces are predicted to overheat - eg, have temperatures above 26° for more than 10% of time steps.
This suggests unheated areas such as the bathroom and kitchen are frequently underheated (potentially increasing mould risk). This highlights a current shortcoming of HEM: it does not model interzonal air movement or heat transfer. In practice, heating demand of these unheated spaces would be met by radiators in surrounding rooms and with air movement through open doors.
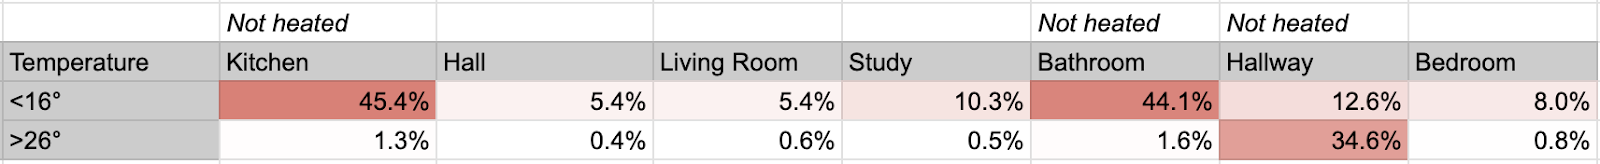 HEM models dynamic temperature across every zone
A similar issue is seen in the first floor hallway. The loft above this space is insulated at the joists (representing the end of the thermal envelope), but with a pitched roof should not experience solar gains. HEM does not appear to directly distinguish between flat roofs and joist-insulated lofts - and as this space has no windows for ventilation, the model predicts overheating.
These issues are ideally fixed by changes to Home Energy Model itself, to better represent complex roof construction and simulate the transfer of energy between rooms. For now they can be mitigated by combining the hallway with other zones, or adjusting thermal properties to prevent the modelling of solar gains on the roof element.
Conclusion and next steps
This case study demonstrated how HEM can be used to model realistic energy use - something not possible with SAP.
Dynamic temperature is another new output of the Home Energy Model, that can provide insight on the comfort impact of designs - though this requires improvements by the HEM team, or "fixing" of model assumptions, to accurately model temperatures of individual zones.
We'll return to this home in a future case study to illustrate how HEM models renewable systems and tariffs.